How to Cascade Metrics From the Board Deck to the Shop Floor

Every portco has dashboards. The board gets a monthly deck. The CEO can rattle off revenue, EBITDA margin, and customer count. Somewhere in the building, there’s a BI tool with seventeen tabs nobody opens.
Now walk downstairs. Ask the plant manager what three metrics they own. Ask the regional sales lead which number they’re trying to move this week. Ask the shift supervisor how their work connects to the EBITDA number the board reviewed last Tuesday.
You’ll get a blank stare. Or worse — a confident answer that has nothing to do with what the board is tracking.
Measurement exists at the top. Activity happens at the bottom. And in between — at the department level, the team level, the role level — there’s a gap where metrics should be but aren’t. The board sees outcomes. The floor sees tasks. Nobody sees the connection.
The Measurement Layer That Doesn’t Exist
Companies don’t lack data. They lack structure.
The board tracks EBITDA, revenue growth, margins — the numbers that drive valuation. Finance owns it. It gets reported monthly. Nobody argues about whether it matters.
At the other end, individual contributors track their tasks. A sales rep knows how many calls they made. A machine operator knows their shift output. That layer exists too, even if it’s informal.
The problem is the middle. The department-level drivers that translate daily activity into business outcomes. Utilization rates. Conversion rates. Throughput by line. Yield percentages. Cost per unit. These are the metrics that explain why EBITDA moved — and they’re the ones most portcos either don’t track, define inconsistently, or never connect to the numbers above or below them.
Carl Press at Thoma Bravo frames the stakes clearly: “If we’re not keeping score, we’re not going to see problems early enough.” He’s not talking about the board deck. The board sees problems eventually — when they show up in quarterly financials. He’s talking about the middle layer, where a 3% drop in throughput on Line 2 is visible in week one but doesn’t hit the P&L until month three.
By the time the board sees it, you’ve lost a quarter.
This Is a Definition Problem, Not a Technology Problem
The instinct is to fix this with software. Buy the better BI platform. Implement the real-time dashboard. Roll out the KPI tracking tool with the slick mobile app.
It doesn’t work. The technology works fine. The definitions don’t.
Before you can cascade a metric, you have to define it. And definition is where organizations fall apart. What counts as “utilization”? Is it billable hours divided by available hours? Does PTO count against available hours? Do internal projects count as billable? Ask three department heads and you’ll get three answers.
This plays out at every level. “Revenue growth” at the board level means one thing. “New business” at the sales level means something slightly different. “Deals closed” at the rep level means something different again. Everyone thinks they’re measuring the same thing. They’re not. Without shared definitions, the cascade is just an org chart with numbers bolted on — it looks connected but the math doesn’t flow.
Define before you connect. Connect before you cascade.
The Three-Level Cascade
The framework is straightforward. Getting it right is not.
Level 1: Business Outcomes — what the PE firm tracks. EBITDA. Revenue growth. Gross margin. Customer retention. These are lagging indicators. They tell you what happened, not why or what to do about it.
Level 2: Department Drivers — what managers own. This is the critical layer. Utilization rate. Sales conversion rate. Production throughput. Customer acquisition cost by channel. These are leading indicators of Level 1 outcomes. When utilization drops, revenue per employee follows. When conversion drops, revenue growth stalls.
Level 3: Individual Metrics — what roles control. Calls made per day. Tickets resolved per shift. Units produced per hour. These activities feed Level 2 drivers, which feed Level 1 outcomes.
The key — the thing that separates a real cascade from a decoration on a slide — is a clear mathematical relationship between levels. Not a vague “this contributes to that.” An actual traceable path.
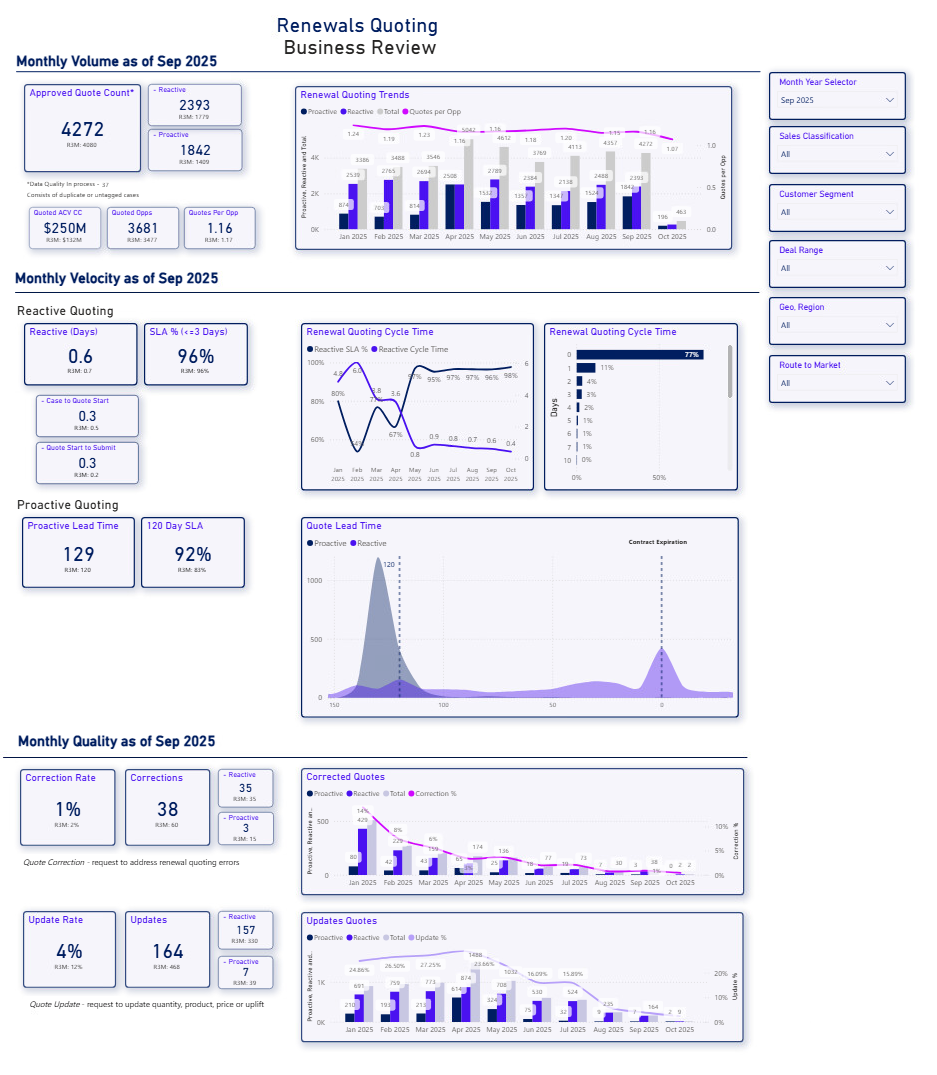
Take a SaaS company’s renewals operation — one I built as a fractional analytics engagement. Level 1 outcome: total pipeline value (the $250M in quoted annual contract value the board tracks). Level 2 driver: quoting velocity — how fast the renewals team processes quotes, measured by cycle time and SLA compliance. Level 3 metric: correction rate and update rate — the individual accuracy metrics that determine whether quotes need rework.
When correction rates climb, quotes take longer. When quotes take longer, cycle time blows past SLA targets. When SLA slips, pipeline velocity stalls and revenue recognition delays. The math flows. The quoting analyst who catches an error on day one prevents a chain reaction that hits the board deck three months later.
The same logic applies in manufacturing (production throughput → line efficiency → EBITDA margin), services (utilization → billable hours → revenue per employee), or logistics (on-time delivery → route efficiency → cost per mile). The industries change. The cascade structure doesn’t.
As Doron Grosman puts it: “Cascade metrics all the way down so everyone knows their impact.” Not “everyone has a dashboard.” Everyone understands the chain.
Building the Cascade: Where the Hand-to-Hand Combat Starts
The framework fits on a slide. Building it is where it gets ugly.
Start with one outcome metric. Not five. Not “all the KPIs.” One. Pick the one that matters most to the value creation plan right now. For most PE-backed portcos in the first twelve months, that’s EBITDA margin or revenue growth.
Now trace backward. What department-level driver has the most direct mathematical relationship to that outcome? For a services business, maybe it’s utilization. For a SaaS company, maybe it’s net revenue retention or quoting velocity. For a manufacturer, maybe it’s production throughput. Pick the driver that, if it moved 5%, would visibly move your Level 1 number.
Then trace one more level. What individual activities feed that driver? What does a person on the floor actually do — every day, every shift — that makes that number go up or down?
This is the work. Not choosing the metrics (that’s the easy part). Wiring them together so the math flows. Brian Neider at Lead Edge calls this “KPI instrumentation” — and the word choice matters. Instrumentation implies engineering. Precision. Connecting sensors to systems so you can read the signal. It’s not picking a dashboard template. It’s building the measurement infrastructure that makes the dashboard meaningful.
The Monday Morning Test. Walk into any department on a Monday morning. Ask the team lead: What are your three metrics? Which one are you focused on this week? How does it connect to what the board tracks?
If they can answer all three without checking a spreadsheet, your cascade is working. If they can’t — and in most portcos, they can’t — you know exactly where the break is.
We introduced this test in the benchmarking gap piece: can your people name the metrics they own? The executives almost always pass. The middle layer almost never does.
Build for Iteration, Not Perfection
Here’s where most implementations stall. Someone decides the cascade needs to be comprehensive before it launches. Every department. Every role. Every metric mapped and validated. Three months later, the business has moved and half the metrics are already wrong.
Start with one vertical slice. One outcome, one driver, one set of individual metrics. Get that cascade working — defined, measured, reviewed weekly. Then add the next driver. Then the next department. Build the muscle of cascaded measurement before you try to scale it.
Same principle behind the benchmarks we covered in what “good” looks like: start with the universal metrics, then layer in sector-specific and company-specific measures. Start narrow. Get it right. Expand.
A single working cascade that connects one outcome to one department to three individual metrics is worth more than a 40-slide deck mapping every KPI in the organization to a theoretical framework nobody uses.
What Changes When the Cascade Works
When your cascade works, three things change.
Problems surface in weeks, not quarters. A spike in quote correction rate shows up in Level 3 metrics on day one. The team lead sees it. The operations manager sees the cycle time impact by end of week. By the time it reaches the board, someone’s already working on it. Compare that to the alternative: the board notices pipeline velocity dropped in Q2, asks the CEO what happened, and everyone scrambles to reconstruct what went wrong three months ago.
Prioritization aligns across the organization. When every team knows which metric they’re moving and how it connects to the outcome the PE firm cares about, trade-off decisions get easier. Should the sales team focus on new logos or expansion? Check the cascade — which activity has a stronger mathematical relationship to the revenue growth target?
Every person can explain their contribution. When the quoting analyst can say “my correction rate target is under 2%, that keeps cycle time under SLA, which keeps pipeline velocity on track for the board’s revenue target” — something shifts. They’re not just doing a job. They’re part of a system they can see. Ownership follows understanding. You don’t have to motivate people to hit metrics they understand — they motivate themselves.
This is what separates portcos that execute value creation plans from portcos that report on them. The difference is whether anyone below the C-suite can trace their daily work to the numbers on slide three.
Where to Start
Pick one outcome metric from your value creation plan. The one that, if it doesn’t move, the deal doesn’t work.
Trace it backward through one department to the individual activities that drive it. Define every metric at every level — not vaguely, precisely. What counts. What doesn’t. How it’s calculated. Make the math explicit.
Then test it. Monday morning. Walk the floor. Ask the questions.
You’ll find the breaks. Every organization has them. The question isn’t whether your cascade is perfect — it’s whether you know where it’s broken and you’re fixing it, one level at a time.
Alex Escoriaza helps PE-backed companies turn board-level KPIs into metrics every team can act on. An analytics maturity assessment can help identify where your cascade breaks down — and what to fix first. Reach out.