What 'Good' Looks Like in PE Portfolio Operations

“We know what good looks like — the problem is most portfolio companies don’t.”
That’s Rob Turano at Bloom Equity. Before you nod along too quickly, consider what he’s actually saying. It’s not that PE firms lack ambition for their portcos. It’s that the baseline definition of “good” — the operational benchmarks that should anchor every value creation plan — doesn’t exist when you walk in the door.
You close the deal. You sit down with the CEO. You ask: Is this margin normal? Is this turnover rate acceptable? How does our utilization compare?
And you get: “We’re doing fine.”
Fine compared to what? Compared to last year? Compared to a competitor they haven’t benchmarked against since 2019? This is a definition problem at its core — nobody has agreed on what “good” means, so every conversation about performance becomes a negotiation instead of an analysis.
The Benchmarking Problem
Here’s why this gap persists. Deal teams collect financial comps — revenue multiples, EBITDA margins at the sector level. That’s what diligence validates. But operational benchmarks? Scrap rates, utilization targets, driver turnover thresholds? Those don’t show up in the data room.
Portco CEOs self-report performance against their own history, not against what’s achievable at their scale. Industry data is fragmented — no single source tells you what a $25M manufacturer’s OEE should be versus a $25M staffing firm’s utilization rate. Trade associations publish some numbers. Consulting firms gate-keep others. PE operators piece it together from experience, peer networks, and instinct.
And generic benchmarks can hurt more than help. A 15% EBITDA margin means something completely different in staffing versus manufacturing versus logistics. Applying the wrong benchmark creates false confidence — or unnecessary panic.
As John Stewart at MiddleGround Capital puts it: “You can’t pay down debt on pro forma adjusted numbers.” The financials that got the deal done aren’t the financials that run the business. You need operational truth.
Tier 1: Universal Metrics (Every Portco, Any Industry)
Five metrics apply regardless of sector. These are your diagnostic baseline — the vital signs before you order specialized tests.
| Metric | What It Tells You | Frequency |
|---|---|---|
| Revenue per employee | Productivity baseline | Monthly |
| Gross margin by service/product line | Where value is created (and where it leaks) | Monthly |
| Customer concentration (top 5) | Revenue risk exposure | Quarterly |
| Employee turnover rate | Organizational health | Monthly |
| Cash conversion cycle | Working capital efficiency | Monthly |
Every one of these should be available from existing systems — ERP, HRIS, CRM, accounting software. The question isn’t whether these metrics are sophisticated enough. The question is whether anyone is pulling them, reviewing them, and making decisions from them.
If your portco can’t produce these five numbers reliably within 30 days of close, you have a data visibility problem that needs solving before anything else. Don’t skip to Tier 2 until Tier 1 is solid.
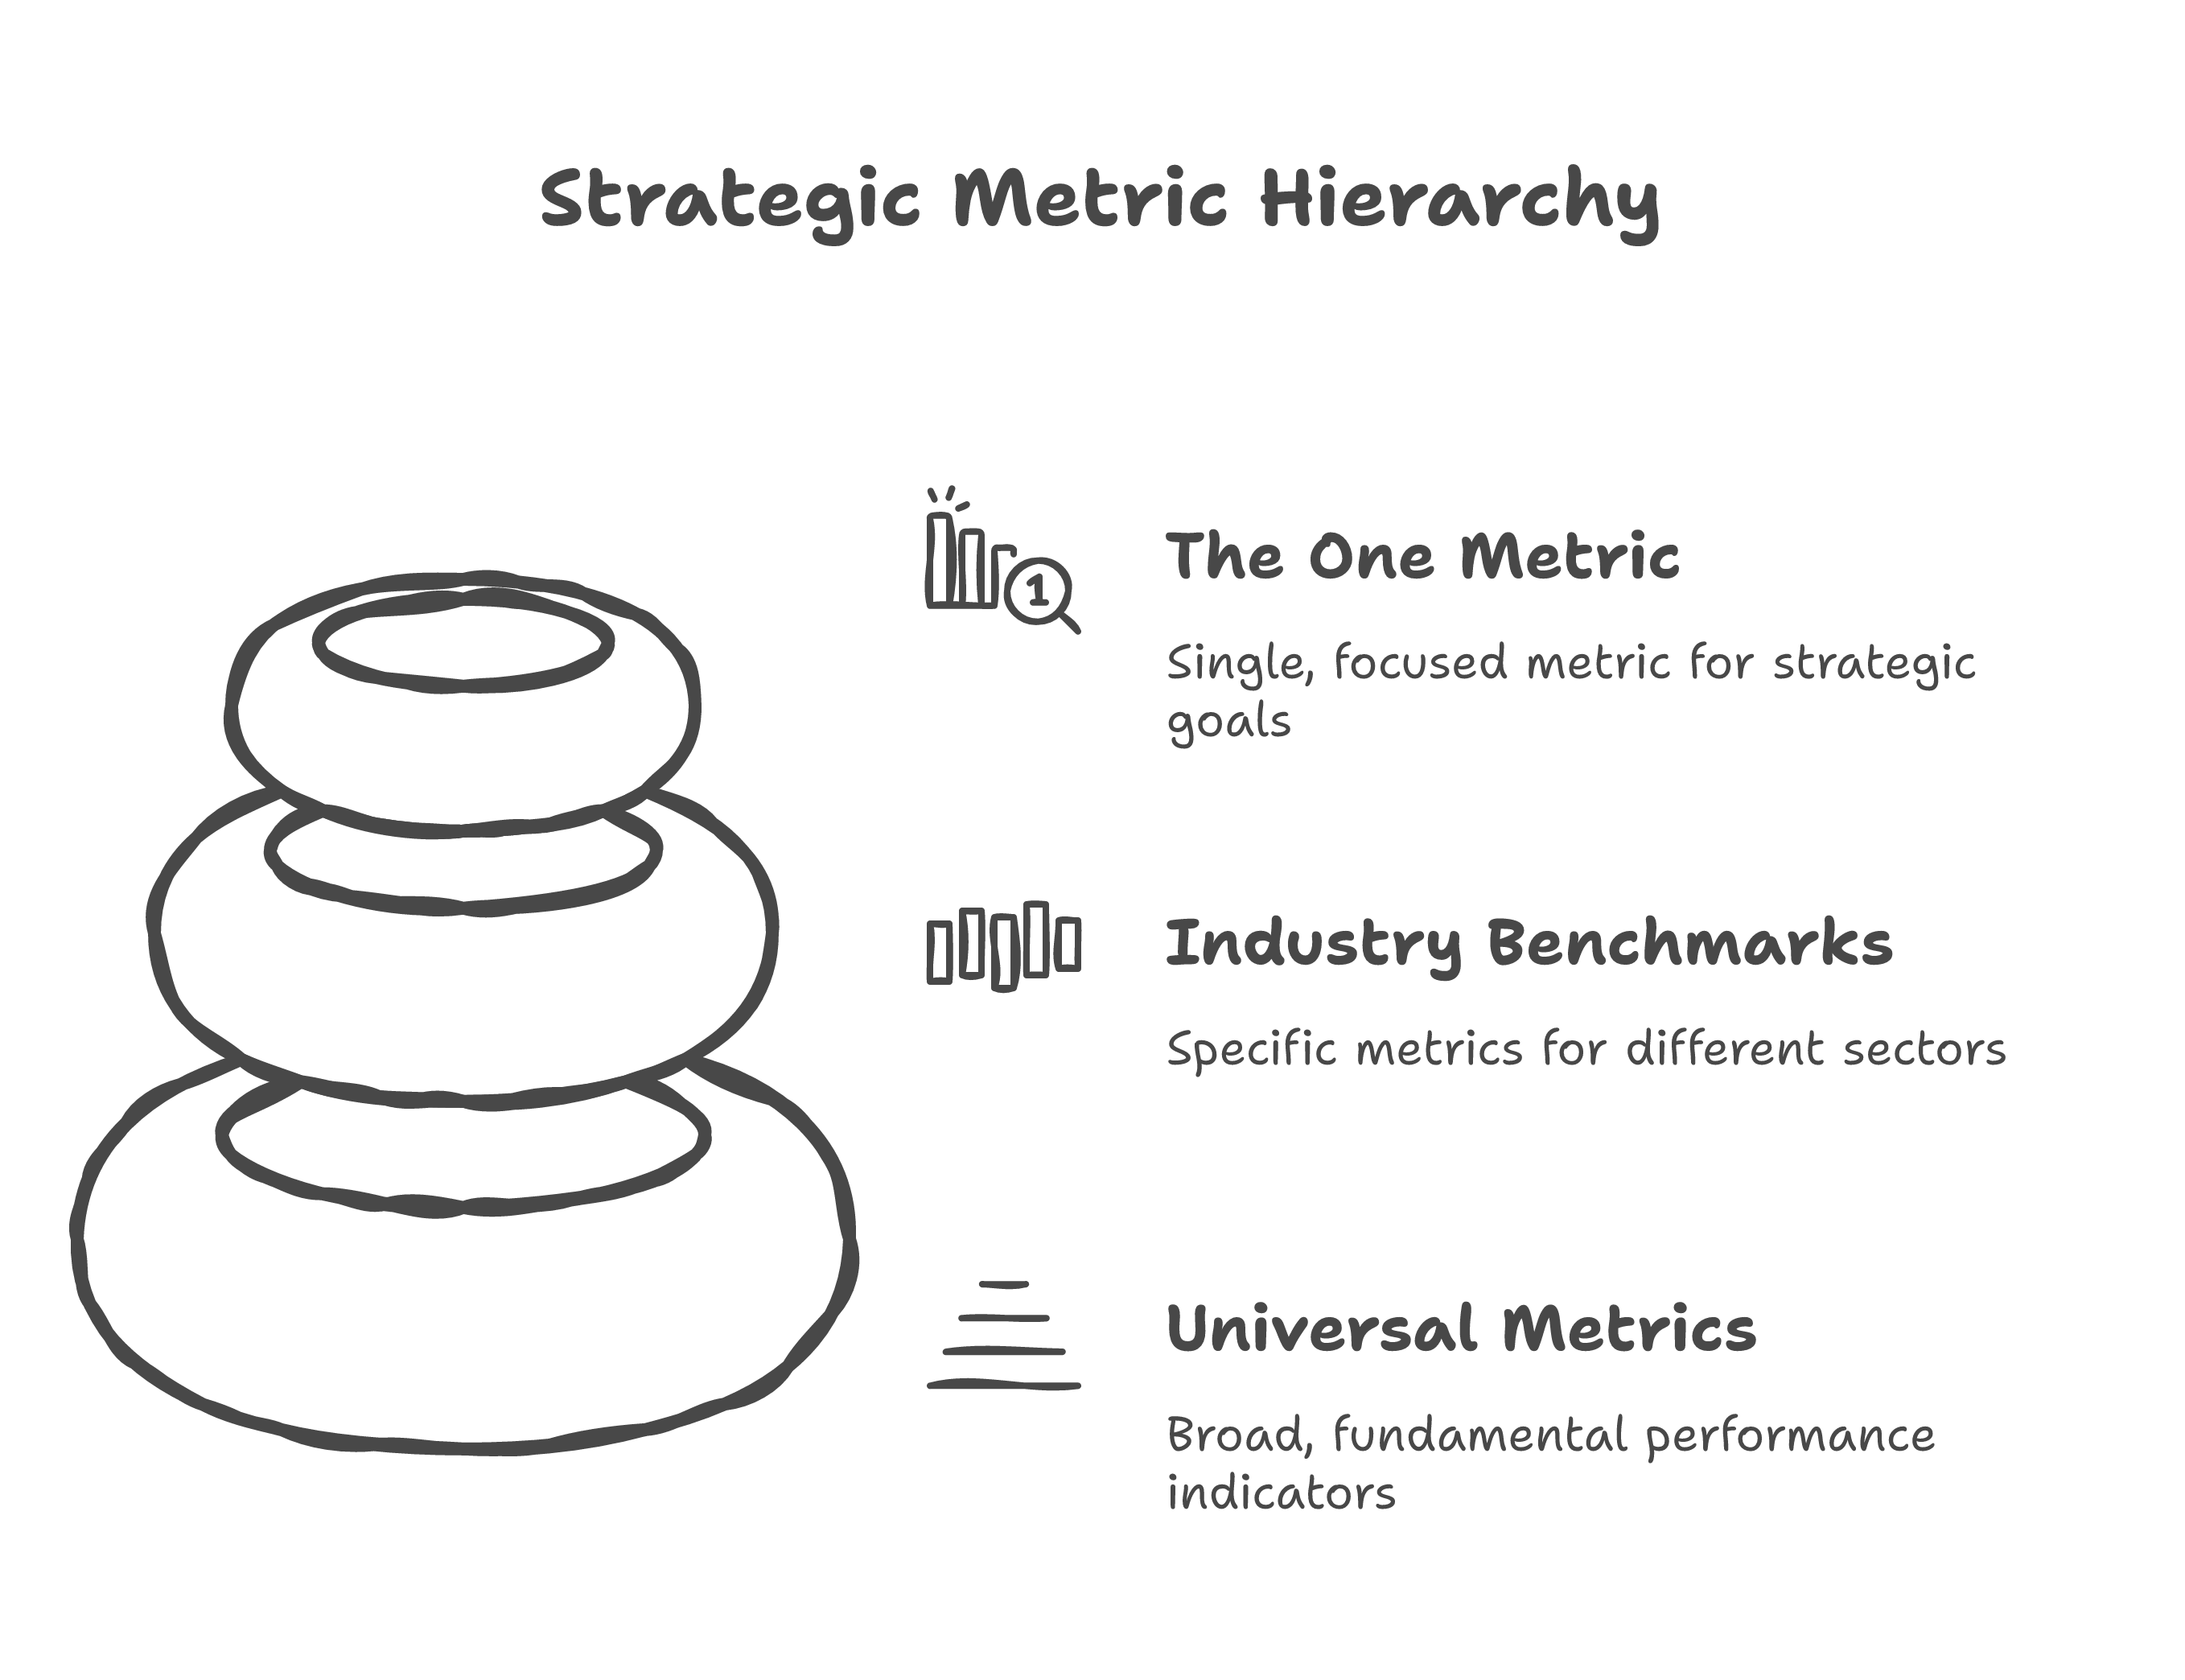
Tier 2: Industry-Specific Benchmarks
This is where figuring out what good looks like gets real. Same metric, wildly different standards depending on the industry. A caveat: these are directional benchmarks for the $10M-$50M range. Sub-sector variation is significant — use these as a starting point for conversation, not a verdict.
Service Businesses ($10M-$50M Revenue)
| Metric | Good | Concerning | World Class |
|---|---|---|---|
| Utilization rate (billable) | 70-80% | <60% | 85%+ |
| Contract renewal rate | 85%+ | <75% | 95%+ |
| Labor cost as % of revenue | 35-50% (depends on service model) | >55% | <30% (tech-enabled) |
| Revenue per FTE | Varies by type | Declining trend | Growing trend |
A 10-point gap in utilization on a $20M revenue base represents roughly $2M in unrealized billing capacity. Even if marginal hours don’t bill at the same rate, that’s not a rounding error. That’s the difference between meeting return targets and having an uncomfortable LP conversation.
SaaS / Software ($10M-$50M ARR)
Before any of these metrics mean anything, the portco needs a clean ARR number — with clear definitions of what’s recurring versus one-time, contracted versus month-to-month. If ARR isn’t well-established, everything below it breaks. This is a definition problem before it’s a benchmarking problem.
| Metric | Good | Concerning | World Class |
|---|---|---|---|
| Net Revenue Retention (NRR) | 100-120% | <100% | 120%+ |
| Gross Revenue Retention (GRR) | 85-95% | <85% | 95%+ |
| Gross Margin | 70-80% | <65% | 80%+ |
| CAC Payback Period | 12-18 months | >24 months | <12 months |
A SaaS portco with NRR below 100% is shrinking from within — existing customers are contracting or churning faster than they expand. No amount of new logo acquisition fixes that. GRR tells you the floor: if you stopped selling tomorrow, how fast does the base erode? Below 85% and you’re on a treadmill. Gross margin below 65% raises a harder question — is this actually a software business, or a services business with a subscription billing model?
Logistics & Distribution ($10M-$50M Revenue)
| Metric | Good | Concerning | World Class |
|---|---|---|---|
| Driver turnover | <50% | >75% | <30% |
| Load factor/fill rate | 85%+ | <75% | 95%+ |
| On-time performance | 95%+ | <90% | 98%+ |
| Cost per mile | Varies by region | Rising trend | Stable/declining |
Industry average driver turnover for large truckload carriers is roughly 90% (per the ATA — smaller fleets and private operations run much lower). If your portco runs at 50%, that’s a competitive advantage most PE firms don’t even know they have. Every driver retained saves $8K-$12K in recruiting and training. At a 100-driver operation, cutting turnover from 90% to 50% saves $300K-$500K annually — straight to EBITDA.
Manufacturing ($10M-$50M Revenue)
| Metric | Good | Concerning | World Class |
|---|---|---|---|
| OEE (Overall Equipment Effectiveness) | 65-75% | <60% | 85%+ |
| Scrap/rework rate | <3% | >5% | <1% |
| On-time delivery | 95%+ | <90% | 98%+ |
| Inventory turns | 6-8 (varies by sub-sector) | <4 | 12+ |
A $30M manufacturer running at 55% OEE isn’t just underperforming — they’re sitting on capacity they’ve already paid for. That’s value creation waiting to happen, if you can see it. Most operating partners walking into a manufacturing portco have never asked about OEE. They look at gross margins and headcount. The operational layer sits underneath, invisible unless you know where to look.
Tier 3: The Company-Specific Metric
Tiers 1 and 2 get you oriented. Tier 3 is where you move beyond the spreadsheets into the operating reality of the business.
Every company has one metric that matters most at the unit level — the number that, if you improve it, everything else follows. The trick is that it’s rarely obvious from the financial statements. You find it by talking to the people who run the operation.
A multi-location dental practice? Production per operatory per hour. It captures provider efficiency, scheduling effectiveness, and capacity utilization all at once.
A commercial janitorial company? Labor cost per square foot by contract type. It tells you which contracts are profitable and which crews are efficient.
A machine shop? Revenue per spindle hour. Machine utilization, job pricing accuracy, and production scheduling in one measure.
As Brooke Ablon at Fort Point Capital says: “Think proactively, act decisively, use your data.” The Tier 3 metric is where that advice becomes operational — the number the floor manager and the CFO can both rally around.
This is where merging the data model and the business model happens. Universal metrics tell you the business exists. Industry benchmarks tell you where it stands. The company-specific metric tells you how it actually works.
How to Establish Benchmarks
1. Start with what they measure today. Even if the data is messy or incomplete — map the gap between what exists and what you need.
2. Identify the 3-5 metrics that predict financial outcomes. Not the 47 KPIs someone built into a dashboard three years ago. The handful of operational measures that, when they move, the P&L moves too. Revenue per employee moving? Margins follow. Utilization climbing? Revenue follows.
3. Source industry benchmarks. Trade associations, industry reports, peer networks, operating partner forums. This step takes effort because the data is fragmented — but it exists. Don’t accept “we don’t have benchmarks for our industry” as an answer. You do. They’re just not aggregated in one place.
4. Contextualize for size. A $10M manufacturer doesn’t benchmark against a $500M one. Revenue scale changes staffing ratios, overhead absorption, purchasing power — everything. Find your weight class.
5. Set achievable targets. Not aspirational fantasies. Measurable 30/60/90-day milestones that move you from “we don’t know” to “here’s what good looks like for us.” Each milestone should be visible to the team executing it — not just the board reviewing it.
Eliot Kerlin at Broadwing Capital frames it well: “We can’t eat LTM EBITDA — that goes to the sellers. We care about NTM.” The benchmarks that matter aren’t the ones that justified the purchase price. They’re the ones that define forward-looking performance.
The Cost of Not Knowing
Every month you operate without clear benchmarks, decisions run on feel. The CEO says margins are fine. The operating partner suspects they’re not. Board conversations turn into debates instead of plans. And the value creation timeline — the one your LPs are watching — slips.
Without benchmarks, Month 3 becomes “let’s figure out what we have.” Month 6 becomes “let’s agree on what to measure.” Month 9 becomes “okay, now we have a baseline.” Three quarters just to reach the starting line. Your hold period doesn’t wait for you to catch up.
The portcos that define “good” early — with real benchmarks, contextualized for their industry and size — compress value creation timelines by months. They skip the baseline debate entirely. The ones that don’t spend their first year arguing about what “normal” means instead of improving it.
The first question in any value creation plan should be: what does good look like for this business? If nobody can answer that with data, everything else is guessing. And guessing, at PE fund economics, is an expensive habit.
Alex Escoriaza helps PE-backed companies figure out what good looks like — with real benchmarks, not guesswork. Reach out.