
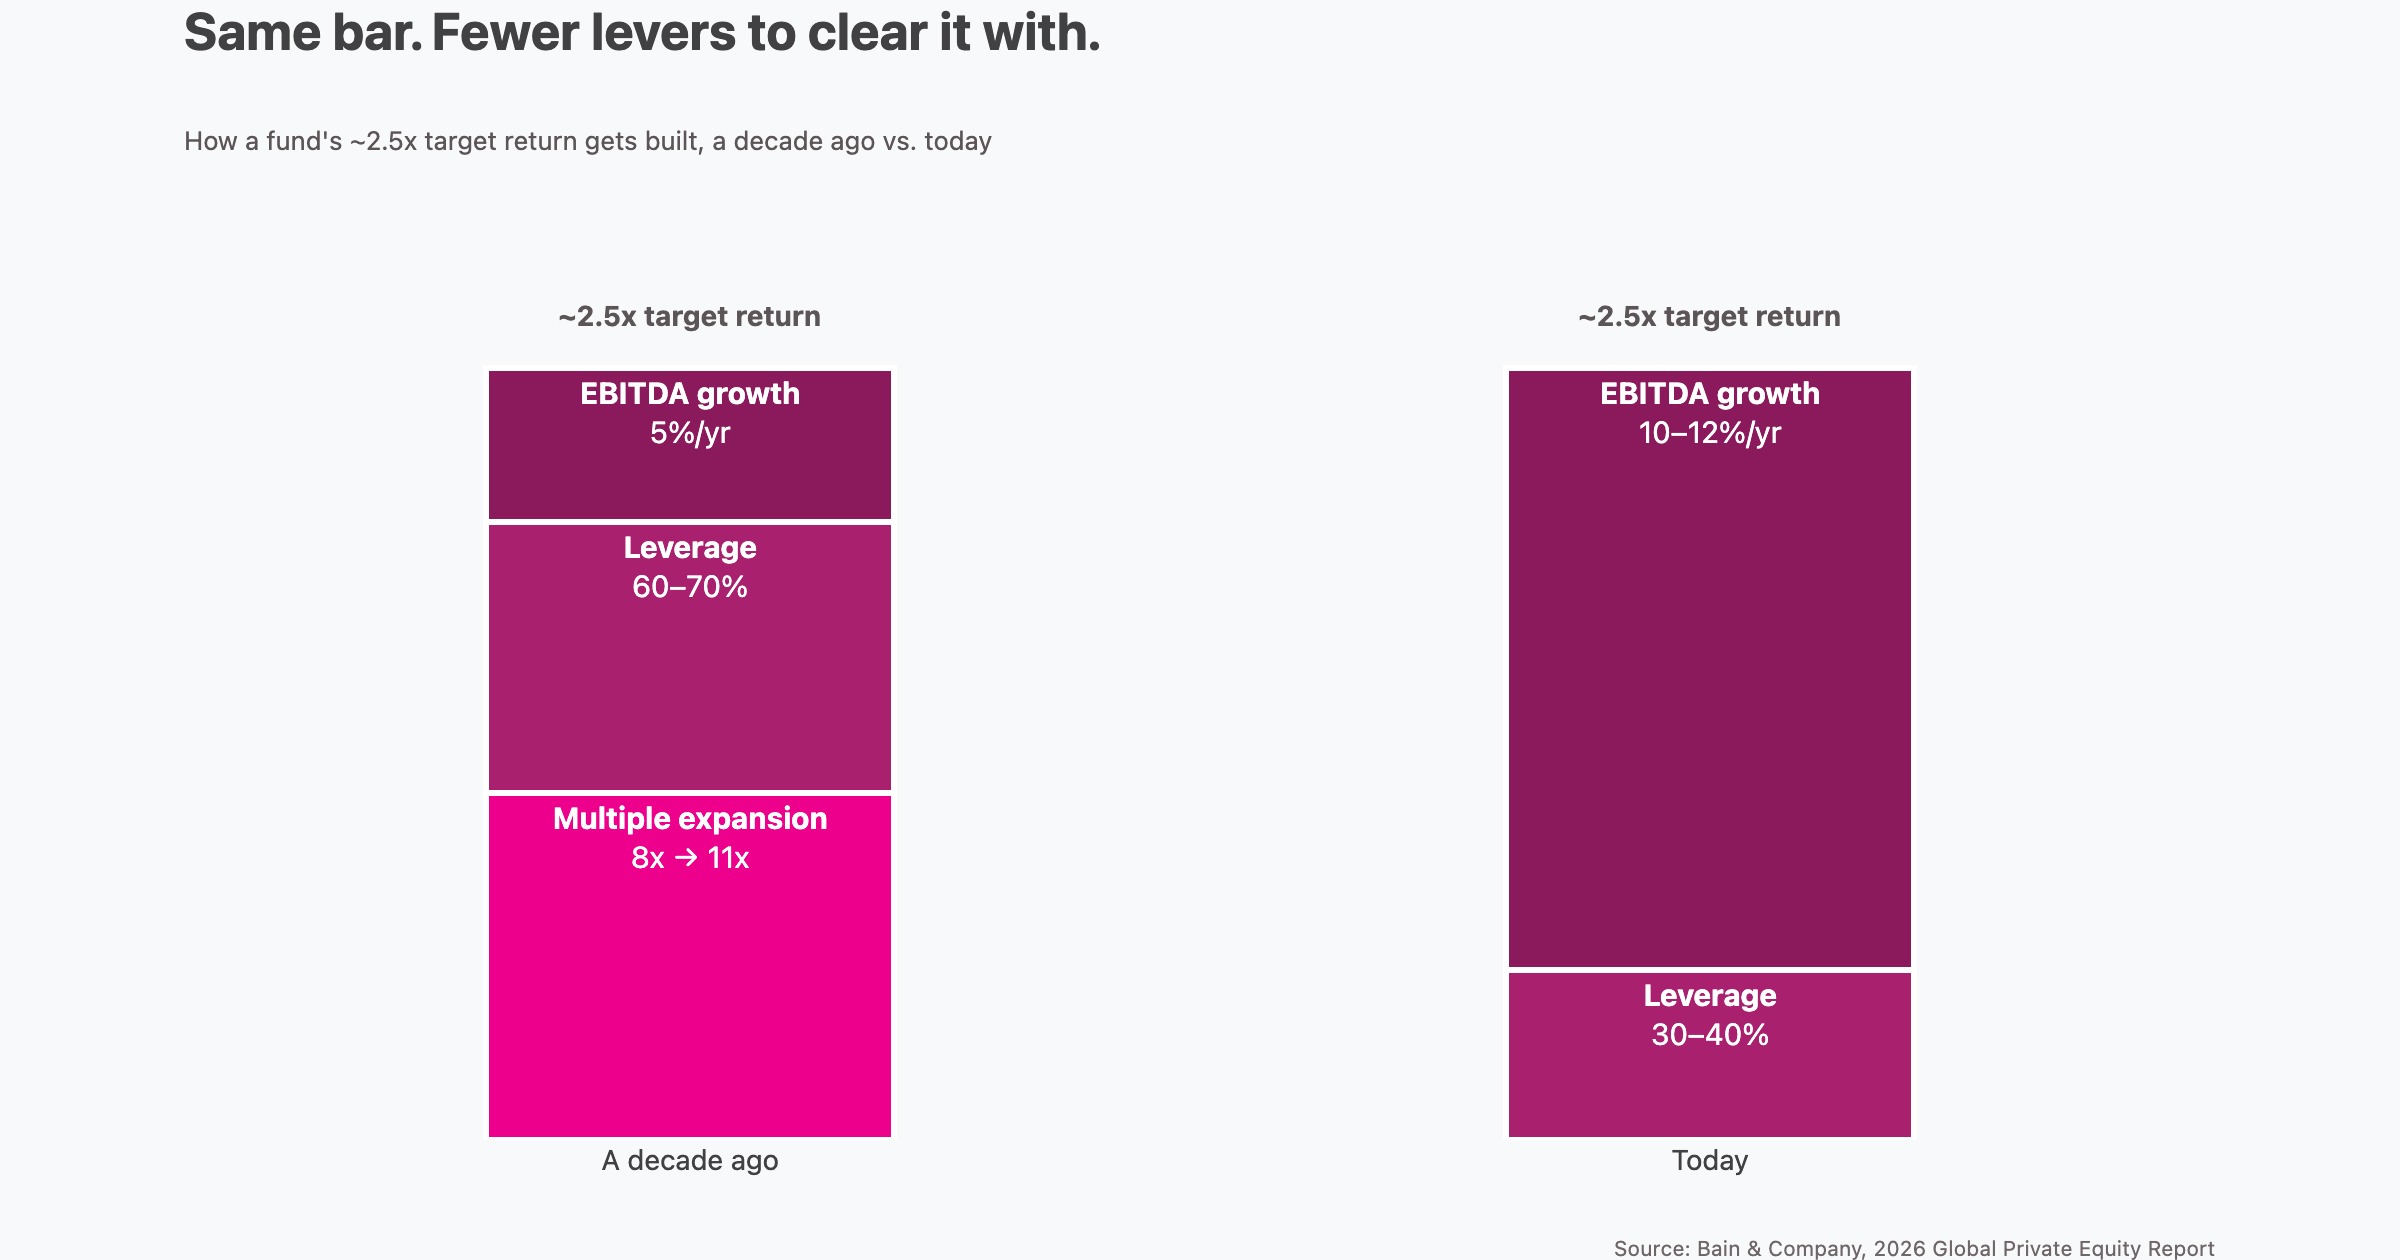
Ten years ago, a private equity deal could work without the business getting much better. Cheap debt did most of the work, multiples drifted upward, and 5% annual EBITDA growth was enough to carry a fund to its target return. Every clause in that sentence is now false, and Bain has put a number on exactly how false.
Picture the Monday board meeting where that lands. You bought the company eighteen months ago. The underwriting says EBITDA should be up double digits by now, and the deck says it’s up. But when you ask where the growth came from — which product lines, which segments, which pricing moves — nobody in the room can answer with a number. They answer with a story. Nobody is lying. The data model just can’t answer the question.
That gap between the number and the explanation used to be survivable. It isn’t anymore.
The Number: 12 Is the New 5
Bain & Company’s 2026 Global Private Equity Report put a name on the shift everyone in the industry has been feeling. Hugh MacArthur and his co-authors compress it into one phrase: 12 is the new 5.
A decade ago, steady EBITDA growth of around 5% a year could underpin strong fund returns. Today, generating the same target return of roughly 2.5x invested capital requires closer to 10-12% annual EBITDA growth. More than double the historical requirement.
The math isn’t mysterious. Bain lays out three forces working together. Borrowing costs sit at 8-9%, not the near-free money of the last cycle. Leverage has compressed to 30-40% of the capital structure, down from the 60-70% that used to do so much heavy lifting. And multiple expansion — buying at 8x and selling at 11x because the market drifted up — is gone.
Strip those out and one lever is left. The business has to get better. Fast.
Three Reports, One Conclusion
When one firm publishes a provocative chart, it’s a marketing document. When the most influential voices in the asset class point the same direction within a few months of each other, it’s a structural read.
KKR’s 2026 Outlook, authored by Henry McVey, frames the shift as “High Grading”: deliberately upgrading portfolios, capital structures, and counterparties for resilience and capital efficiency. McVey is explicit about where the returns now live: “More operational improvement stories, especially those linked to capital heavy to capital light models.” Not financial improvement stories. Operational ones.
RSM UK’s own 2026 analysis of value creation uses the same figures as Bain, without naming a source: “A decade ago, steady EBITDA growth of around 5% each year could underpin strong returns. Today, closer to 12% growth is typically required to achieve the same outcome.” And it names the implication in plain language: “Investors are no longer rewarded for simply optimising capital structures. Instead, returns are increasingly driven by what happens inside the business.”
Three institutions. One conclusion. The alpha that’s left is operational, or there isn’t any. I’ve made the pre-close version of this argument — the leverage-and-multiples playbook is finished as a return strategy before. That piece is about what to stop underwriting. This one is about what you signed up for after the wire clears.
Why This Is a Data Model Problem, Not a Metrics Problem
Here’s where most of the commentary stops, and where the real problem starts.
Everyone reads “12 is the new 5” and concludes their portcos need to track more metrics. Add a growth KPI. Watch EBITDA more closely. Build a nicer dashboard. That’s treating it as a metrics problem, and it will fail.
Twelve percent EBITDA growth isn’t something you report your way into. It’s something you engineer — through pricing, revenue mix, cost structure, and productivity. And every one of those levers requires data the business was never built to produce.
Walk the levers one by one. Pricing discipline requires margin by product and service line; most portcos only have blended margins. Revenue mix requires per-stream P&Ls; most have one consolidated P&L. Cost structure work requires operational cost tracking in something close to real time; most close the books monthly, look backward, and move on. Talent productivity requires output metrics; most measure headcount and hope.
You cannot manage any of that from quarterly financial reports. The reporting infrastructure that comfortably supported 5% growth isn’t merely inadequate for 12%. It’s the wrong instrument. It was built to record what happened, not to steer what happens next.
That’s the reframe. The problem isn’t a missing metric. It’s that the data model, how information is captured, structured, and connected inside the company, doesn’t match the business model you underwrote. You bought a company you intend to grow 12% a year. You inherited a data model designed to survive at 5%. When the data model doesn’t match the business model you bought, the math doesn’t work, no matter how disciplined the operator.
The K-Shaped Split This Creates
Bain’s report carries a second finding worth sitting with: the recovery is K-shaped. Deal value surged 44% to $904 billion in 2025 and exit value jumped 47% to $717 billion, but the gains concentrated. Elite funds are thriving. Everyone else is muddling through.
The differentiator is no longer access to cheap debt, which everyone lost at once. It’s operational capability and the data-backed proof of execution LPs now demand. Bain’s prescription is blunt: build systems, not slogans. “We sort of do everything” is no longer a persuasive pitch in a fundraising meeting — and fundraising fell 16% year over year in 2025, so those meetings are harder to get.
The split runs straight down into the portfolio. Portcos with real operational visibility can find the 12% and prove where it came from. The ones flying on consolidated financials and monthly hindsight can’t, and increasingly can’t hide it. The talent market has noticed too: some of the sharpest people in the industry are already moving to the operational side of this divide. Which side of the K a company lands on has less to do with its sector than with whether anyone in that Monday board meeting can answer: where did the growth come from, in numbers?
What This Demands, Concretely
Two of KKR’s data points sharpen the urgency. The outlook notes the S&P 500’s implied 10-year CAGR has climbed to roughly 16%, versus an 8% historical average, while the premium for high-quality global stocks has fallen to about 17%, near an eight-year low. Private markets have to generate genuine operational alpha to justify the allocation and the fee. And the fee itself is compressing: Bain’s report, citing Preqin, puts the average buyout management fee at 1.6% in 2025, down from the traditional 2%.
The pressure travels downhill. LPs lean on GPs to prove operational improvement. GPs lean on portcos to produce the data that proves it. The portco that can’t produce it becomes the weak line in the fundraising deck.
Take KKR’s capital-heavy-to-capital-light thesis. Say you’re moving a portfolio company from project-based revenue to recurring contracts, a classic value-creation play. You cannot prove that transition is working from a consolidated P&L. You need recurring and non-recurring revenue as distinct streams, tracked over time, with the margin profile of each. If the data model can’t separate them, you can’t manage the transition — and you certainly can’t put it in front of an LP as proof of work rather than proof of concept.
None of this is exotic. It’s the difference between a business that can put its performance in numbers and one that can only gesture at it. I’ve written about why so many PE-backed companies can’t define good performance in numbers, and about cascading a headline metric down to the actions that move it. At 12% required growth, those aren’t nice-to-haves. They’re the cost of entry.
The Stakes
The uncomfortable part is the timeline. Building operational visibility means restructuring how data is captured, connecting the operational and financial views, and getting to margin by product and revenue by stream. That is not a quarter of work. It’s a two-to-three-year build if you start today.
Which means the portcos that start now hold a two-to-three-year head start on the ones waiting for a board meeting to go badly first. At 12% required EBITDA growth, a year of flying blind is a year you can’t correct course, can’t defend the plan, and can’t prove execution to an LP who has stopped accepting slogans.
The old math forgave a lot. You could grow modestly, structure cleverly, and let the market carry you to a good exit. The new math forgives nothing. It asks one question of every portfolio company: can you deliver, and demonstrate, double-digit operational improvement year after year? For most PE-backed companies, the honest answer isn’t no. It’s we can’t even see whether we are. That’s the gap to close first.
Alex Escoriaza helps PE-backed companies rebuild the data model to match the business model they actually bought: margin by product, revenue by stream, growth you can point to. If the reporting was built for 5% and the plan now says 12%, that rebuild is worth scoping before the next board meeting. Get in touch.